ဖိုင်:2005ICT.PNG

မူရင်းဖိုင် (၁၄၂၅ × ၆၂၅ pixels, ဖိုင်အရွယ်အစား - ၅၉ KB, MIME အမျိုးအစား image/png)
| ဤဖိုင်သည် Wikimedia Commons မှဖြစ်ပြီး အခြားပရောဂျက်များတွင် သုံးကောင်းသုံးလိမ့်မည်။ ယင်း၏ ဖိုင်အကြောင်းစာမျက်နှာ တွင် ဖော်ပြထားချက်ကို အောက်တွင် ပြထားသည်။ Commons သည် မူပိုင်ခွင့်လွတ်လပ်သော မီဒီယာဖိုင်များ သိုလှောင်ထားရာ နေရာ ဖြစ်သည်။ သင်လည်း ပါဝင်ကူညီနိုင်ပါသည်။ |
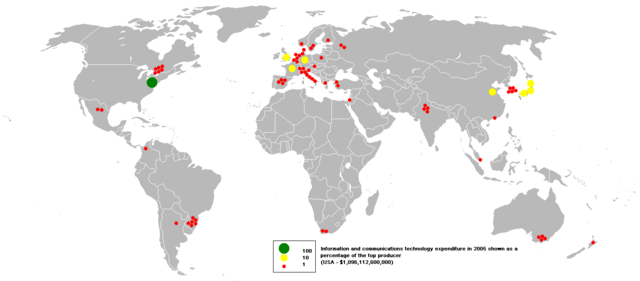
| ဖော်ပြချက် |
This bubble map shows the global distribution of spending on information and communication technologies in 2005 as a percentage of the top market (USA - $1,096,112,600,000). This map is consistent with incomplete set of data too as long as the top market is known. It resolves the accessibility issues faced by colour-coded maps that may not be properly rendered in old computer screens. Data was extracted on 4th July 2007 from http://siteresources.worldbank.org/DATASTATISTICS/Resources/table5_11.pdf Based on Image:BlankMap-World.png |
||
| ရင်းမြစ် | Originally uploaded at en wiki by User:Anwar saadat under PD-self licence | ||
| စာရေးသူ | en:User:Anwar saadat | ||
| ခွင့်ပြုချက် (ဤဖိုင်ကို ပြန်လည်အသုံးပြုခြင်း) |
|

|
This economic map image could be re-created using vector graphics as an SVG file. This has several advantages; see Commons:Media for cleanup for more information. If an SVG form of this image is available, please upload it and afterwards replace this template with
{{vector version available|new image name}}.
It is recommended to name the SVG file “2005ICT.svg”—then the template Vector version available (or Vva) does not need the new image name parameter. |
ဖိုင်မှတ်တမ်း
ဖိုင်ကို ယင်းနေ့စွဲ အတိုင်း မြင်နိုင်ရန် နေ့စွဲ/အချိန် တစ်ခုခုပေါ်တွင် ကလစ်နှိပ်ပါ။
| နေ့စွဲ/အချိန် | နမူနာပုံငယ် | မှတ်တမ်း ဒိုင်မန်းရှင်းများ | အသုံးပြုသူ | မှတ်ချက် | |
|---|---|---|---|---|---|
| ကာလပေါ် | ၀၁:၅၈၊ ၂၇ အောက်တိုဘာ ၂၀၀၇ | | ၁၄၂၅ × ၆၂၅ (၅၉ KB) | Shushruth | {{Description=This bubble map shows the global distribution of spending on information and communication technologies in 2005 as a percentage of the top market (USA - $1,096,112,600,000). This map is consistent with incomplete set of data too as long as |
ဖိုင်သုံးစွဲမှု
အောက်ပါ 2 စာမျက်နှာများ သည် ဤဖိုင်ကို အသုံးပြုထားသည်:
ဂလိုဘယ် ဖိုင်သုံးစွဲမှု
အောက်ပါ အခြားဝီကီများတွင် ဤဖိုင်ကို အသုံးပြုထားသည်-
- an.wikipedia.org တွင် အသုံးပြုမှု
- ar.wikipedia.org တွင် အသုံးပြုမှု
- as.wikipedia.org တွင် အသုံးပြုမှု
- ba.wikipedia.org တွင် အသုံးပြုမှု
- be-tarask.wikipedia.org တွင် အသုံးပြုမှု
- ca.wikipedia.org တွင် အသုံးပြုမှု
- es.wikipedia.org တွင် အသုံးပြုမှု
- gl.wikipedia.org တွင် အသုံးပြုမှု
- hi.wikipedia.org တွင် အသုံးပြုမှု
- id.wikipedia.org တွင် အသုံးပြုမှု
- jv.wikipedia.org တွင် အသုံးပြုမှု
- ka.wikipedia.org တွင် အသုံးပြုမှု
- kk.wikipedia.org တွင် အသုံးပြုမှု
- kn.wikipedia.org တွင် အသုံးပြုမှု
- la.wikipedia.org တွင် အသုံးပြုမှု
- mhr.wikipedia.org တွင် အသုံးပြုမှု
- min.wikipedia.org တွင် အသုံးပြုမှု
- mk.wikipedia.org တွင် အသုံးပြုမှု
- mwl.wikipedia.org တွင် အသုံးပြုမှု
- ro.wikipedia.org တွင် အသုံးပြုမှု
- ru.wikipedia.org တွင် အသုံးပြုမှု
- si.wikipedia.org တွင် အသုံးပြုမှု
- sk.wikipedia.org တွင် အသုံးပြုမှု
- so.wikipedia.org တွင် အသုံးပြုမှု
- sw.wikipedia.org တွင် အသုံးပြုမှု
- tn.wikipedia.org တွင် အသုံးပြုမှု
- vi.wikipedia.org တွင် အသုံးပြုမှု
- zh.wikipedia.org တွင် အသုံးပြုမှု