ဖိုင်:MATLAB surf sinc3D.svg

Size of this PNG preview of this SVG file: ၅၁၂ × ၃၈၄ ပစ်ဇယ်. အခြား ပုံရိပ်ပြတ်သားမှု: ၃၂၀ × ၂၄၀ ပစ်ဇယ် | ၆၄၀ × ၄၈၀ ပစ်ဇယ် | ၁၀၂၄ × ၇၆၈ ပစ်ဇယ် | ၁၂၈၀ × ၉၆၀ ပစ်ဇယ် | ၂၅၆၀ × ၁၉၂၀ ပစ်ဇယ်။
မူရင်းဖိုင် (SVG ဖိုင်, ၅၁၂ × ၃၈၄ pixels ကို အကြံပြုသည်, ဖိုင်အရွယ်အစား - ၁.၃၁ MB)
| ဤဖိုင်သည် Wikimedia Commons မှဖြစ်ပြီး အခြားပရောဂျက်များတွင် သုံးကောင်းသုံးလိမ့်မည်။ ယင်း၏ ဖိုင်အကြောင်းစာမျက်နှာ တွင် ဖော်ပြထားချက်ကို အောက်တွင် ပြထားသည်။ Commons သည် မူပိုင်ခွင့်လွတ်လပ်သော မီဒီယာဖိုင်များ သိုလှောင်ထားရာ နေရာ ဖြစ်သည်။ သင်လည်း ပါဝင်ကူညီနိုင်ပါသည်။ |
အကျဉ်းချုပ်
| ဖော်ပြချက် |
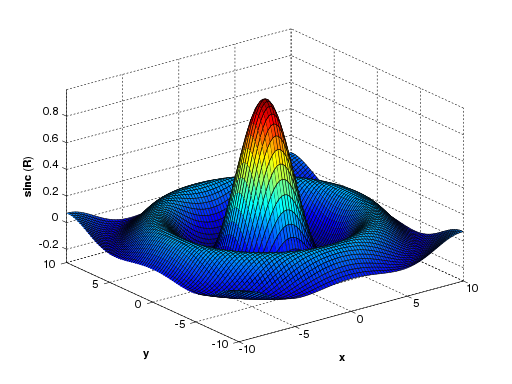
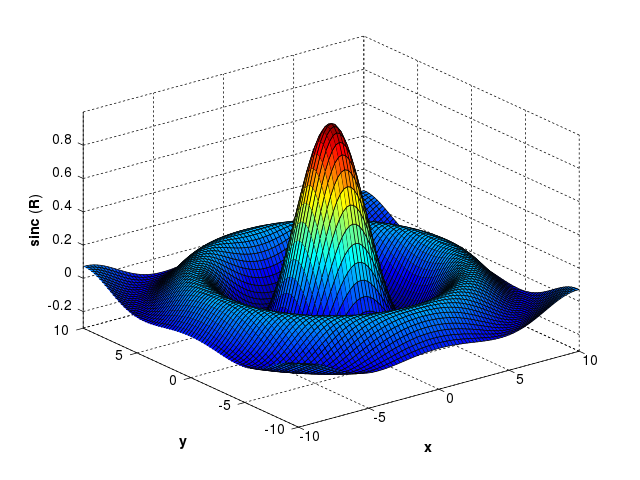
A three-dimensional surface plot of the unnormalized sinc function — precisely, |
| ရက်စွဲ | |
| ရင်းမြစ် | ကိုယ်ပိုင်ဖန်တီးမှု |
| စာရေးသူ | DmitTrix |
| အခြား ဗားရှင်းများ |
|
| SVG genesis | ဤ SVG ၏ ကုဒ်သည် ခိုင်လုံသည်။ This diagram was created with MATLAB. |
| ဆို့စ်ကုတ်ဒ် | MATLAB code[X,Y] = meshgrid(-10:0.25:10,-10:0.25:10);
f = sinc(sqrt((X/pi).^2+(Y/pi).^2));
h = figure(1);
surf(X,Y,f);
axis([-10 10 -10 10 -0.3 1])
xlabel('{\bfx}')
ylabel('{\bfy}')
zlabel('{\bfsinc} ({\bfR})')
hidden off
plot2svg('sinc3D.svg',h) % utilizes the SVG exporting script (by Juerg Schwizer)
% available from MATLAB Central File Exchange
|


လိုင်စင်သတ်မှတ်ခြင်း
| I, the copyright holder of this work, release this work into the public domain. This applies worldwide. In some countries this may not be legally possible; if so: အကျွန်ုပ်သည် ဤဖန်တီးမှုလက်ရာကို ဥပဒေအရလိုအပ်ခြင်းမရှိသည့် မည်သည့်အခြေအနေမျိုးတွက်မဆို၊ မည်သို့သော ရည်ရွယ်ချက်အတွက်မဆို ၎င်းကို မည်သူမဆို အသုံးပြုပိုင်ခွင့်အား ပေးအပ်သည်။ |
ဖိုင်မှတ်တမ်း
ဖိုင်ကို ယင်းနေ့စွဲ အတိုင်း မြင်နိုင်ရန် နေ့စွဲ/အချိန် တစ်ခုခုပေါ်တွင် ကလစ်နှိပ်ပါ။
| နေ့စွဲ/အချိန် | နမူနာပုံငယ် | မှတ်တမ်း ဒိုင်မန်းရှင်းများ | အသုံးပြုသူ | မှတ်ချက် | |
|---|---|---|---|---|---|
| ကာလပေါ် | ၂၀:၃၃၊ ၂၄ မေ ၂၀၀၈ | | ၅၁၂ × ၃၈၄ (၁.၃၁ MB) | DmitTrix | {{Information |Description=A three-dimentional surface plot of the ''unnormalized'' '''sinc''' function — precisely, <math>\begin{align} & -10\le x\le 10 \\ & -10\le y\le 10 \\ & z=\operatorname{sinc}\left( \sqrt{x^ |
ဖိုင်သုံးစွဲမှု
အောက်ပါ စာမျက်နှာ သည် ဤဖိုင်ကို အသုံးပြုထားသည်:
ဂလိုဘယ် ဖိုင်သုံးစွဲမှု
အောက်ပါ အခြားဝီကီများတွင် ဤဖိုင်ကို အသုံးပြုထားသည်-
- bg.wikipedia.org တွင် အသုံးပြုမှု
- en.wikipedia.org တွင် အသုံးပြုမှု
- en.wikiversity.org တွင် အသုံးပြုမှု
- es.wikipedia.org တွင် အသုံးပြုမှု
- et.wikipedia.org တွင် အသုံးပြုမှု
- fa.wikibooks.org တွင် အသုံးပြုမှု
- hu.wikipedia.org တွင် အသုံးပြုမှု
- hy.wikipedia.org တွင် အသုံးပြုမှု
- ko.wikipedia.org တွင် အသုံးပြုမှု
- mk.wikipedia.org တွင် အသုံးပြုမှု
- mr.wikipedia.org တွင် အသုံးပြုမှု
- ta.wikipedia.org တွင် အသုံးပြုမှု
- tr.wikipedia.org တွင် အသုံးပြုမှု
- uk.wikipedia.org တွင် အသုံးပြုမှု
- uz.wikipedia.org တွင် အသုံးပြုမှု