မူရင်းဖိုင်(၆၀၀၀ × ၆၀၀၃ pixels, ဖိုင်အရွယ်အစား - ၁၆.၉၃ MB, MIME အမျိုးအစား image/jpeg)

အကျဉ်းချုပ်

ဖော်ပြချက်
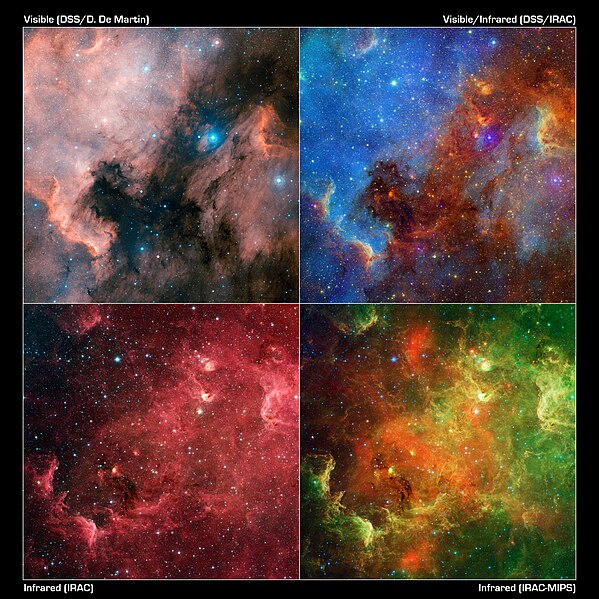
English: This layout of images reveals how the appearance of the North America nebula can change dramatically using different combinations of visible and infrared observations from the Digitized Sky Survey and NASA's Spitzer Space Telescope, respectively.

In this progression, the visible-light view (upper left) shows a striking similarity to the North America continent. Each is cropped to the easterly bulk (thus also the quasi-"Gulf of Mexico" region). The red region to the right is known as the "Pelican nebula," after its resemblance in visible light to a pelican.

The view at upper right includes both visible and infrared observations. The hot gas comprising the North America continent and the Pelican now takes on a vivid blue hue, while red colours display the infrared light. Inky black dust features start to glow in the infrared view.

In the bottom two images, only infrared light from Spitzer is shown -- data from the infrared array camera is on the left, and data from both the infrared array camera and the multi-band imaging photometer, which sees longer wavelengths, is on the right. These pictures look different in part because infrared light can penetrate dust whereas visible light cannot. Dusty, dark clouds in the visible image become transparent in Spitzer's view. In addition, Spitzer's infrared detectors pick up the glow of dusty cocoons enveloping baby stars.
ရက်စွဲ
ရင်းမြစ် NASA JPL
စာရေးသူ NASA/JPL-Caltech/L. Rebull (SSC/Caltech)
အခြား ဗားရှင်းများ

Colour is used to display different parts of the spectrum in each of these images. In the visible-light view (upper right) from the Digitized Sky Survey, colours are shown in their natural blue and red hues. The combined visible/infrared image (upper left) shows visible light as blue, and infrared light as green and red. The infrared array camera (lower left) represents light with a wavelength of 3.6 microns as blue, 4.5 microns as green, 5.8 microns as orange, and 8.0 microns as red. In the final image, incorporating the multi-band imaging photometer data, light with a wavelength of 3.6 microns has been colour coded blue; 4.5-micron light is blue-green; 5.8-micron and 8.0-micron light are green; and 24-micron light is red.

လိုင်စင်သတ်မှတ်ခြင်း

Public domain This file is in the public domain in the United States because it was solely created by NASA. NASA copyright policy states that "NASA material is not protected by copyright unless noted". (See Template:PD-USGov, NASA copyright policy page or JPL Image Use Policy.)
Warnings:
Annotations
InfoField
This image is annotated: View the annotations at Commons

ပုံစာများ

ဤဖိုင်၏ဆိုလိုရင်းကို စာတစ်ကြောင်းရှင်းလင်းချက်ဖြင့် ထည့်သွင်းရန်

Items portrayed in this file

depicts အင်္ဂလိပ်

၁၀ ဖေဖော်ဝါရီ 2011

media type အင်္ဂလိပ်

image/jpeg

checksum အင်္ဂလိပ်

072f8138d0a40afbadada6d45a544ebbe35f38f0

determination method အင်္ဂလိပ်: SHA-1 အင်္ဂလိပ်

data size အင်္ဂလိပ်

၁၇၇၅၃၉၀၁ ဘိုက်

height အင်္ဂလိပ်

၆၀၀၃ pixel

width အင်္ဂလိပ်

၆၀၀၀ pixel

ဖိုင်မှတ်တမ်း

ဖိုင်ကို ယင်းနေ့စွဲ အတိုင်း မြင်နိုင်ရန် နေ့စွဲ/အချိန် တစ်ခုခုပေါ်တွင် ကလစ်နှိပ်ပါ။

နေ့စွဲ/အချိန်နမူနာပုံငယ်မှတ်တမ်း ဒိုင်မန်းရှင်းများအသုံးပြုသူမှတ်ချက်
ကာလပေါ် ၁၂:၀၉၊ ၁၆ ဖေဖော်ဝါရီ ၂၀၁၁ ၁၂:၀၉၊ ၁၆ ဖေဖော်ဝါရီ ၂၀၁၁ ရက်က မူအတွက် နမူနာပုံငယ်၆၀၀၀ × ၆၀၀၃ (၁၆.၉၃ MB)Originalwana{{Information |Description ={{en|1=This image layout reveals how the appearance of the North America nebula can change dramatically using different combinations of visible and infrared observations from the [[:Category:Digitized

အောက်ပါ စာမျက်နှာ သည် ဤဖိုင်ကို အသုံးပြုထားသည်:

ဂလိုဘယ် ဖိုင်သုံးစွဲမှု

အောက်ပါ အခြားဝီကီများတွင် ဤဖိုင်ကို အသုံးပြုထားသည်-

မီတာဒေတာ