ဖိုင်:Standard deviation diagram.svg

Size of this PNG preview of this SVG file: ၄၀၀ × ၂၀၀ ပစ်ဇယ်. အခြား ပုံရိပ်ပြတ်သားမှု: ၃၂၀ × ၁၆၀ ပစ်ဇယ် | ၆၄၀ × ၃၂၀ ပစ်ဇယ် | ၁၀၂၄ × ၅၁၂ ပစ်ဇယ် | ၁၂၈၀ × ၆၄၀ ပစ်ဇယ် | ၂၅၆၀ × ၁၂၈၀ ပစ်ဇယ်။
မူရင်းဖိုင် (SVG ဖိုင်, ၄၀၀ × ၂၀၀ pixels ကို အကြံပြုသည်, ဖိုင်အရွယ်အစား - ၁၇ KB)
| ဤဖိုင်သည် Wikimedia Commons မှဖြစ်ပြီး အခြားပရောဂျက်များတွင် သုံးကောင်းသုံးလိမ့်မည်။ ယင်း၏ ဖိုင်အကြောင်းစာမျက်နှာ တွင် ဖော်ပြထားချက်ကို အောက်တွင် ပြထားသည်။ Commons သည် မူပိုင်ခွင့်လွတ်လပ်သော မီဒီယာဖိုင်များ သိုလှောင်ထားရာ နေရာ ဖြစ်သည်။ သင်လည်း ပါဝင်ကူညီနိုင်ပါသည်။ |
အကျဉ်းချုပ်
| ဖော်ပြချက် |
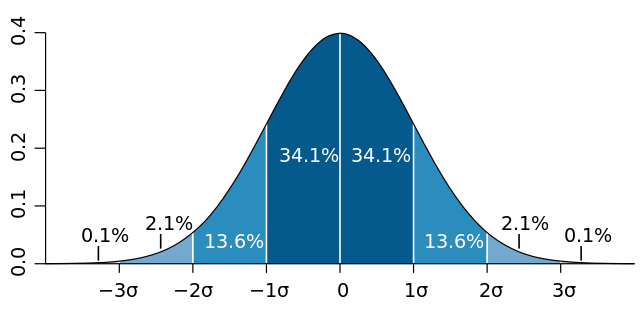
English: Normal distribution curve that illustrates standard deviations. Each band has 1 standard deviation, and the labels indicate the approximate proportion of area (note: these add up to 99.8%, and not 100% because of rounding for presentation.)
Français : Courbe de distribution normale montrant l'écart type. Chaque bande verticale a une largeur d'un écart type et les pourcentages indiquent leur valeur approximative rapportée à la population totale. Note : du fait des arrondis, le total est de 99,8 % au lieu de 100%. |
| ရက်စွဲ | |
| ရင်းမြစ် | ကိုယ်ပိုင်ဖန်တီးမှု, based (in concept) on figure by Jeremy Kemp, on 2005-02-09 |
| စာရေးသူ | M. W. Toews |
| အခြား ဗားရှင်းများ |
|
.svg)
လိုင်စင်သတ်မှတ်ခြင်း
ဤဖိုင်သည် Creative Commons Attribution 2.5 Generic လိုင်စင်အောက်တွင် လိုင်စင်သတ်မှတ်ထားပါသည်။
- သင်သည် လွတ်လပ်စွာ:
- မျှဝေရန် – ဖန်တီးမှုကို ကူးယူရန်၊ ဖြန့်ဖြူးရန်နှင့် ထုတ်လွှင့်ရန်
- ပြန်ရောနှောရန် – ဖန်တီးမှုကို ပြင်ဆင်ညှိနှိုင်းရန်
- အောက်ပါ အခြေအနေများတွင်:
- မှတ်ယူနိုင်ခြင်း – ပြောင်းလဲမှုများ ပြုလုပ်ခဲ့ပါက ဖန်တီးသူ သို့မဟုတ် လိုင်စင်ရှိသူမှ သတ်မှတ်သော အမျိုးအစားကို လိုက်နာရမည် (ဆိုလိုသည်မှာ သင့်အား သို့မဟုတ် သင့်ဖန်တီးမှုတွင် အသုံးပြုခြင်းအား ထောက်ခံချက်ပေးသည်ဟု မဆိုလိုပါ)။
ဖိုင်မှတ်တမ်း
ဖိုင်ကို ယင်းနေ့စွဲ အတိုင်း မြင်နိုင်ရန် နေ့စွဲ/အချိန် တစ်ခုခုပေါ်တွင် ကလစ်နှိပ်ပါ။
| နေ့စွဲ/အချိန် | နမူနာပုံငယ် | မှတ်တမ်း ဒိုင်မန်းရှင်းများ | အသုံးပြုသူ | မှတ်ချက် | |
|---|---|---|---|---|---|
| ကာလပေါ် | ၀၂:၀၆၊ ၁၅ ဇန်နဝါရီ ၂၀၁၅ | | ၄၀၀ × ၂၀၀ (၁၇ KB) | GliderMaven | Average is now zero not mu |
| ၁၁:၀၈၊ ၇ ဧပြီ ၂၀၀၇ |  | ၄၀၀ × ၂၀၀ (၁၄ KB) | Petter Strandmark | == Summary == Standard deviation diagram, based an original graph by Jeremy Kemp, in 2005-02-09 [http://pbeirne.com/Programming/gaussian.ps]. This figure was started in R using: <pre> x <- seq(-4,4,.1) plot(x,dnorm(x),type |
ဖိုင်သုံးစွဲမှု
ဤဖိုင်ကို အသုံးပြုထားသော စာမျက်နှာများမရှိပါ။
ဂလိုဘယ် ဖိုင်သုံးစွဲမှု
အောက်ပါ အခြားဝီကီများတွင် ဤဖိုင်ကို အသုံးပြုထားသည်-
- af.wikipedia.org တွင် အသုံးပြုမှု
- ar.wikipedia.org တွင် အသုံးပြုမှု
- ast.wikipedia.org တွင် အသုံးပြုမှု
- as.wikipedia.org တွင် အသုံးပြုမှု
- ba.wikipedia.org တွင် အသုံးပြုမှု
- be-tarask.wikipedia.org တွင် အသုံးပြုမှု
- bew.wikipedia.org တွင် အသုံးပြုမှု
- bg.wikipedia.org တွင် အသုံးပြုမှု
- bn.wikipedia.org တွင် အသုံးပြုမှု
- bs.wikipedia.org တွင် အသုံးပြုမှု
- ca.wikipedia.org တွင် အသုံးပြုမှု
- cbk-zam.wikipedia.org တွင် အသုံးပြုမှု
- cs.wikipedia.org တွင် အသုံးပြုမှု
- cv.wikipedia.org တွင် အသုံးပြုမှု
- cy.wikipedia.org တွင် အသုံးပြုမှု
- dag.wikipedia.org တွင် အသုံးပြုမှု
- da.wikipedia.org တွင် အသုံးပြုမှု
- de.wikipedia.org တွင် အသုံးပြုမှု
- de.wikiversity.org တွင် အသုံးပြုမှု
- el.wikipedia.org တွင် အသုံးပြုမှု
- en.wikipedia.org တွင် အသုံးပြုမှု
ဤဖိုင်ကို အခြားနေရာများတွင် အသုံးပြုထားမှုများအား ကြည့်ရှုရန်။